The Graph Structure of the Connectome and Synaptome Datasets
An exploratory analysis of the graph structure of the connectome and synaptome of fly brain circuits and local processing units is shown in the figure below. For more details, see
- Aurel A. Lazar, Tingkai Liu, Mehmet K. Turkcan, and Yiyin Zhou, FlyBrainLab: Accelerating the Discovery of the Functional Logic of the Fruit Fly Brain in the Connectomic and Synaptomic Era, eLife 2021;10:e62362, February 2021.
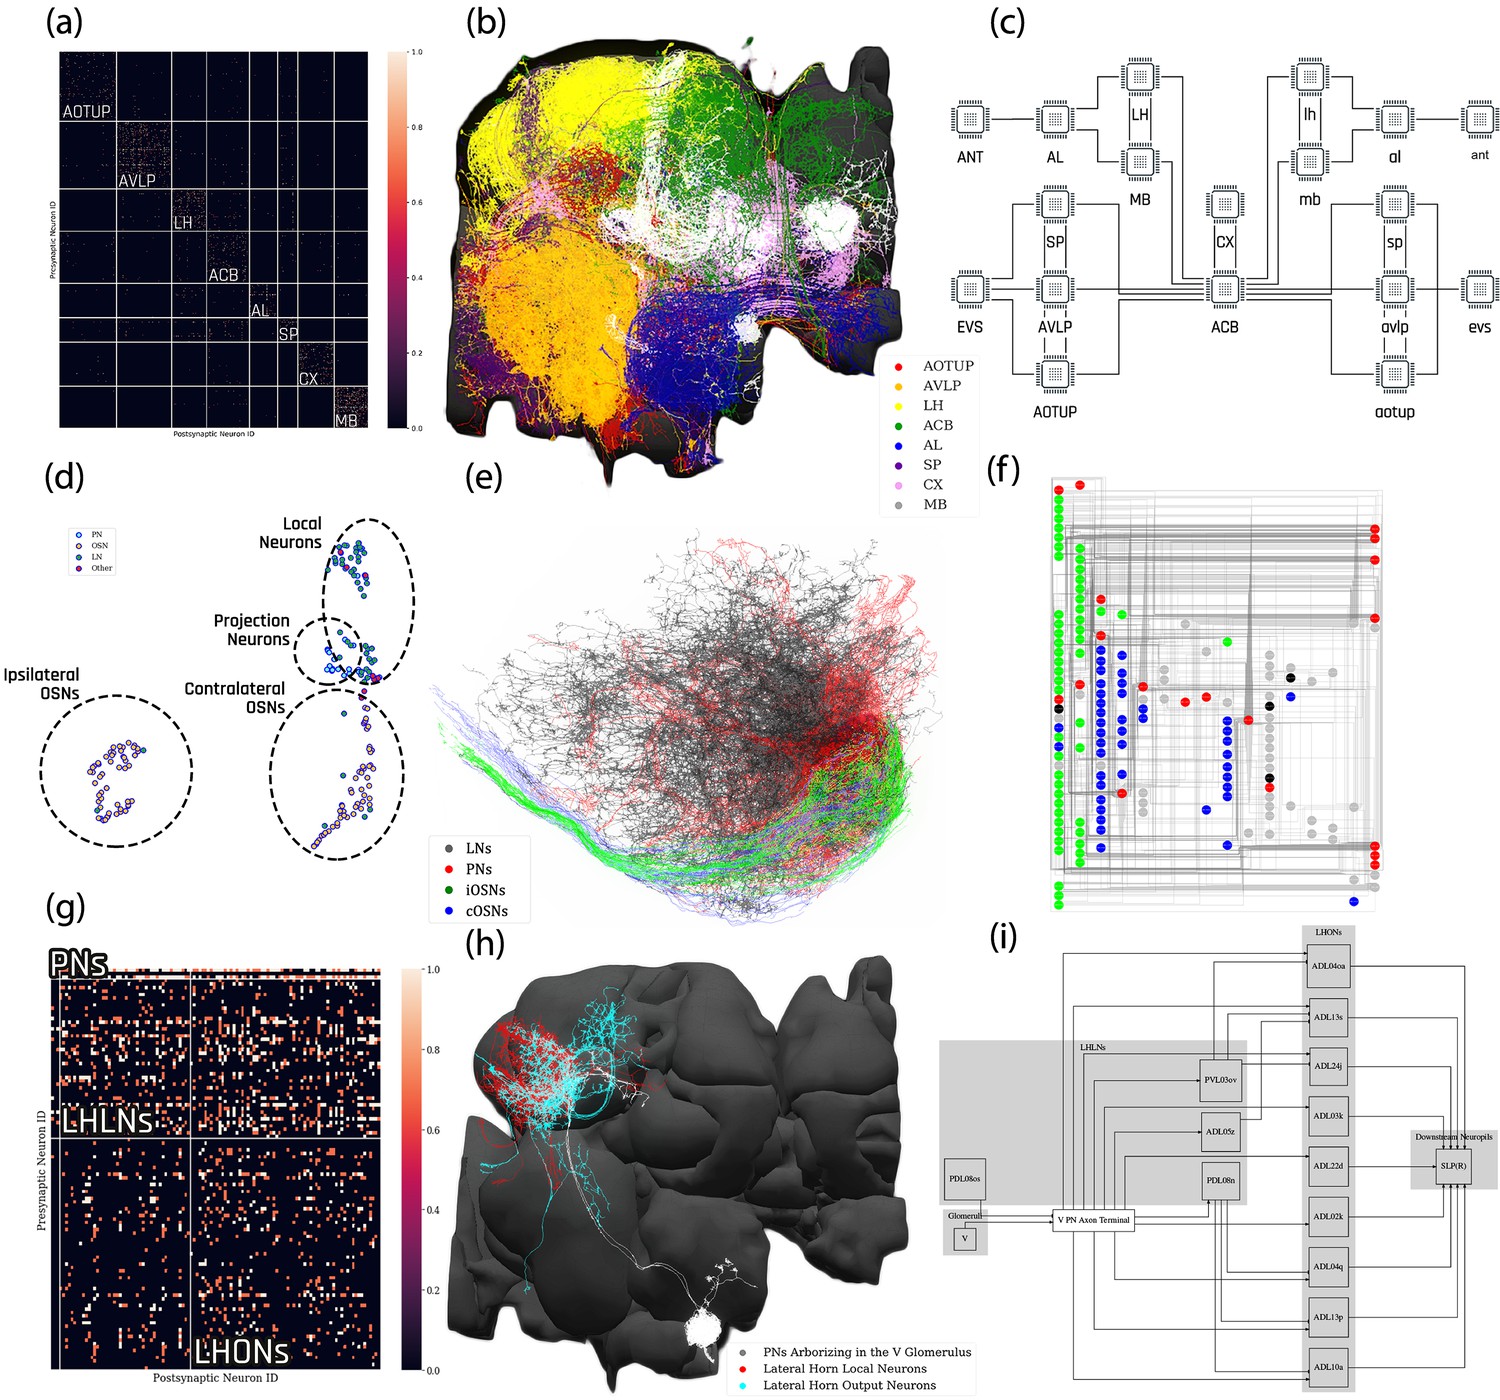
- Louvain algorithm applied to all neurons in the Hemibrain dataset showing eight groups of densely connected neurons. Color indicates the value of log10 (n+1), where n is the number of synapses; values larger than one are shown in the same color as value 1. AOTUP: anterior optic tubercle with additional neurons of the posterior brain, AVLP: anterior ventrolateral protocerebrum, LH: lateral horn, ACB: neurons in the anterior central brain, AL: antennal lobe, SP: superior protocerebrum, CX: central complex, MB: mushroom body. Labels were added after visually inspecting the neurons in each group of neurons in (b).
- A subset of neurons pseudo-colored according to the group they belong to in (a).
- A brain-level circuit diagram created by hand according to the grouping of neurons and the inter-group edge information obtained in (a). Visual and olfactory inputs from, respectively, the early visual system (EVS) and antenna (ANT) were added. Groups in the left hemisphere were added by symmetry.
- Adjacency Spectral Embedding algorithm applied to the VA1v connectome dataset using the NeuroGraph library. The color of each circle indicates the cell-type labeling from the original dataset. Groups of neurons labeled by dashed circles are based on validated cell types.
- Visualization of neurons analyzed in (d). Neuron colors were assigned according to the groups in (d).
- A circuit diagram of the VA1v circuit analyzed in (d) automatically generated by the NeuroGraph Library.
- Connectivity matrix of the lateral horn neurons downstream the V glomerulus projection neurons of the antennal lobe. Colorbar configured in the same way as in (a).
- Morphology of the neurons in (g). (white) PNs arborizing in the V glomerulus, (red) LHLNs, (cyan) LHONs.
- A circuit diagram automatically generated by the circuit visualization utilities of NeuroGraph starting with the circuit in (g) and (h), and the superior lateral protocerebrum (SLP), the primary neuropil that the LHONs project to.
- Aurel A. Lazar, Mehmet K. Turkcan and Yiyin Zhou, A Programmable Ontology Encompassing the Functional Logic of the Drosophila Brain, Frontiers in Neuroinformatics, April 2022.
The Bionet Group is supported by grants from
 |
 |
 |
 |